

Providing communication tools for building
the Seamless World
通信で隙間のない世界を創る
Communication
tools
製品紹介
無線やレーダー探知機など
幅広い製品群を展開
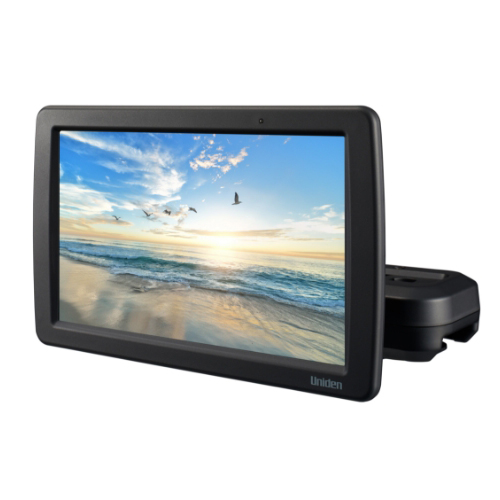
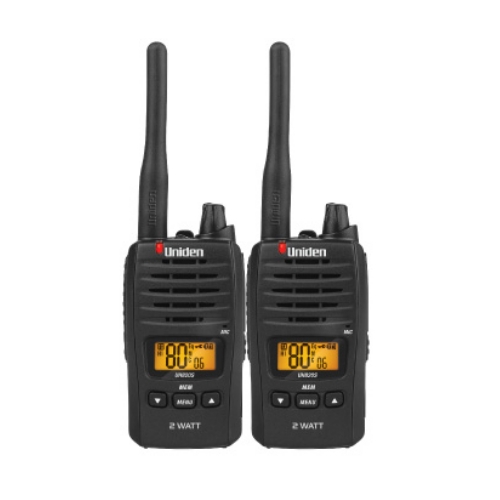
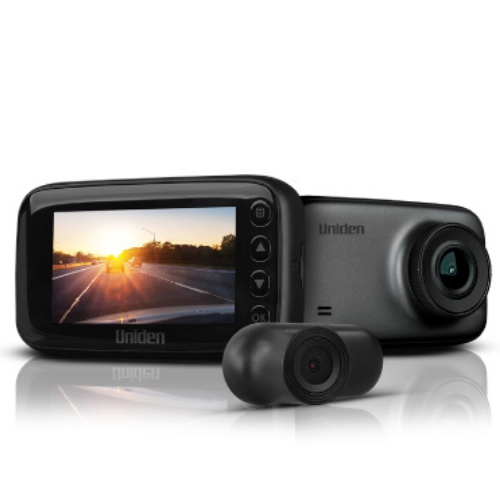
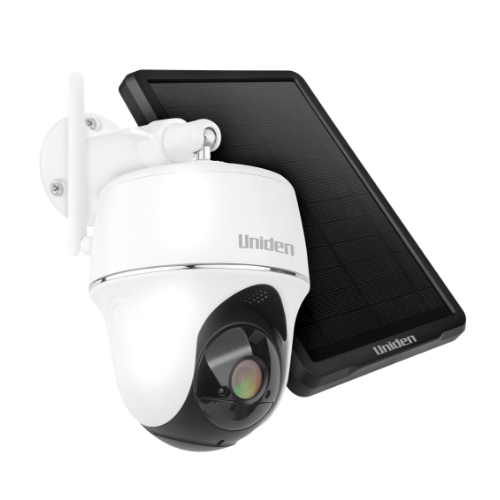
1980年代以来、アメリカ市場におけるコードレス電話の代名詞として親しまれてきたユニデンブランドは、現在では無線やレーダー探知機など幅広い製品群を展開。また、海上無線やスキャナーなどをラインナップに加え、その活躍の舞台をオーストラリア、ヨーロッパに広げてきました。今後も、培われたコミュニケーションテクノロジーを武器にシェアの拡大をねらいます。


The features of
Uniden business
ユニデンビジネスの特徴

Company profile
会社概要

